#CNBC Market Data Scraping
Explore tagged Tumblr posts
Visit Tumblr Blog
Explore Tumblr blogs with no restrictions, modern design and the best experience.
Last Seen Tumblr Blogs


Fun Fact
12.7% of mobile users access Tumblr.
Text
How Does Python Facilitate Stock Data Scraping From Various Sources?
How Does Python Facilitate Stock Data Scraping From Various Sources?
In the dynamic realm of finance, access to precise stock data is crucial for sound investment choices. Yet, manually aggregating this information from numerous websites is laborious and time-intensive. Thankfully, Python provides an efficient remedy through finance data scraping, with Selenium rising as a favored tool for extracting dynamic content. This article delves into harnessing Selenium and Python to scrape stock data from diverse websites, facilitating profound insights into financial markets. By automating the data retrieval, investors can swiftly access accurate stock data, enabling informed decision-making and strategic investments. This approach streamlines the data collection process and empowers investors with real-time market insights, facilitating agility and competitiveness in the ever-evolving financial landscape. The ability to scrape stock data using Python and Selenium offers a valuable toolkit for investors seeking to navigate and capitalize on market trends effectively.
Here is a list of popular websites where you can find stock data:
Yahoo Finance
Google Finance
Bloomberg
CNBC
MarketWatch
Reuters
Investing.com
Real-time stock quotes.
Market analysis.
In-depth reports from a team of experienced journalists and analysts.
Users can extract stock data from Reuters' platform, including prices, market trends, and company reports, for analysis and decision-making.
Understanding Python Web Scraping with Selenium
Selenium is a versatile automation tool that allows you to interact with web pages as a user would. Combined with Python's extensive data manipulation and analysis libraries, Selenium provides a comprehensive solution for scraping stock data from various websites.
Setting Up Your Environment: Before diving into web scraping, you must set up your Python environment and install the necessary packages. Ensure you have Python installed on your system, and install Selenium using pip:
pip install selenium
You'll also need to download a web driver compatible with your preferred browser (e.g., Chrome, Firefox). WebDriver acts as a bridge between your Python script and the browser, allowing Selenium to automate interactions.
Repeat this process for each data you want to extract, such as stock prices, volume, or market trends.
Handling Dynamic Content and Pagination: Many stock websites feature dynamic content and pagination, which can complicate the scraping process. Selenium excels at handling such scenarios, allowing you to seamlessly interact with dynamic elements and navigate multiple pages.
To handle pagination, identify the navigation elements (e.g., "Next Page" buttons) and use Selenium to click on them programmatically. Repeat this process until you've scraped all the desired data from each page.
Storing and Analyzing Data: Once you've scraped the stock data, you can store it in a structured format such as CSV, Excel, or a database for further analysis. Python's pandas library is handy for data manipulation and analysis, allowing you to perform calculations, visualize trends, and derive insights from the scraped data.
Conclusion: Stock data scraping services provide a powerful means to efficiently access and analyze stock data from various sources. By leveraging tools like Selenium, users can automate the process of gathering real-time stock quotes, news, and financial information from platforms such as Yahoo Finance, Google Finance, Bloomberg, CNBC, MarketWatch, Reuters, and Investing.com. It enables investors to make informed decisions, track market trends, and identify investment opportunities more efficiently and accurately. Scraping stock data using Pythion and Selenium, the financial market becomes more accessible, empowering investors to stay ahead of the curve and maximize their investment potential.
Get in touch with iWeb Data Scraping for a wide array of data services! Our team will provide expert guidance if you require web scraping service or mobile app data scraping. Contact us now to discuss your needs for scraping retail store location data. Discover how our tailored data scraping solutions can bring efficiency and reliability to meet your specific requirements effectively.
Know More : https://www.iwebdatascraping.com/python-facilitate-stock-data-scraping.php
#HowDoesPythonFacilitateStockDataScraping#WebScrapingforStockPricesinPython#ScrapeStockPricingDatainPython#ScrapingYahooFinanceDatausingPython#Scrapestockdatafromdiversewebsites#ScrapestockdatausingPythonandSelenium#ScrapeBloombergsstockdata#Stockdatascrapingservices
0 notes
Link
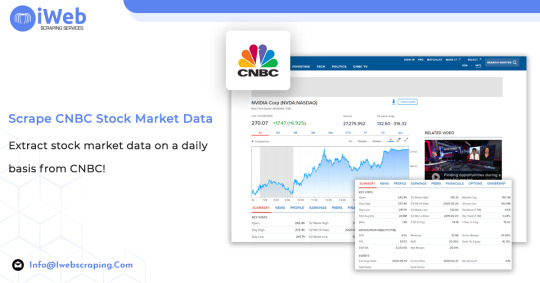
Extract stock market data on a daily basis from CNBC by getting the price of open, day high, day low, 10 day average volume, beta, 52 week high, 52 week high data, market cap, shares out, dividend, yield, etc for any of the stock.
Scrape CNBC Stock Market Data
0 notes
Text
RECENT NEWS & STUDIES - APRIL 2019

Welcome to CindyLouWho2′s periodic roundup of news, tutorials and studies from the world of ecommerce, content marketing & social media. This is my first time posting this news here on my new Tumblr account, so please let me know how the format is working out; I want to make it as readable as possible. I am working on making the links a little more obvious; I may have to change templates to do that.
Sorry it is so long this time. I am working on getting it back down to a post once every 10 days at most, but it might take me til May to get back on track.
TOP NEWS & ARTICLES
Google core algorithm update started March 12; early winners & losers here and here, among other info about the update.
Also, Google accidentally de-indexed some pages last week, & they are still working on fixing it.
Etsy phone support finally available to everyone (if you speak English, of course).
Amazon no longer requires Marketplace sellers to keep their prices elsewhere the same or higher as on Amazon.
Worldpay, one of Etsy’s payment providers, sold to FIS for $35 billion. (Etsy also uses Ayden for some of their payment processing.)
TOP ETSY NEWS
Last week, Etsy sent emails to non-US sellers, telling them that their refunds for the overcharging that has been going on since October 2018 will be issued by the end of the day, June 30th (or earlier). It doesn’t mention when they will stop overcharging, though.
Etsy held Investor Day on March . You can view the slides that went along with the presentations, and there is a short summary of the search info discussed here. CEO Josh Silverman then did an interview with CNBC (video only), which is summarized here.
There was an Etsy podcast on search questions (links to recording, and transcription), but it didn’t have any new info.
They’ve also released their spring & summer trends report, with a podcast & transcript, as well as a lengthy pdf file with keyword data (I will be summarizing that separately).
SEO: GOOGLE & OTHER SEARCH ENGINES
Rand Fishkin (founder of Moz) is doing a series of 10-minute Whiteboard Friday presentations on learning SEO basics, with both video & transcripts included in the links. Remember, some of these things do not apply to Etsy shops, but can apply to your website, depending on the coding.
Part 1, SEO strategy; It assumes some knowledge of marketing terms, but the SEO part is definitely intro-level
Part 2, keyword research. Long tail: “20% of all searches that Google receives each day they have never seen before.”
Part 3: satisfy searcher needs.
Part 4: optimizing through keywords & other elements.
And Moz’s Beginners Guide to SEO is finally fully updated. (Some parts are more technical, so stick to the on-page stuff if you are really new to this.)
Chrome now offering the ability to select privacy-focused search engine DuckDuckGo as your browser default. This should increase DDG’s slice of traffic if Google continues this.
Google released its Webspam report for 2018.
Hmm, wonder why I would come across SEO tips for Tumblr this edition? 🤔
CONTENT MARKETING & SOCIAL MEDIA
(includes blogging & emails)
19 call-to-action phrases you should be using on social media (infographic)
10 tips for more clicks on your social media posts
US social media expansion has plateaued, but podcasts’ popularity continues to grow. 23% of US homes have a “smart speaker” (Alexa etc.); 56% have a tablet. Smartphone ownership has also levelled off.
Related - most Americans dislike/do not trust social media.
3 tips for great social media content (infographic), & 4 more tips for writing social media posts.
Email marketing stats that show its impact. If you don’t already have an email list, it is time to start one. After all these years, it still works!
Instagram beta-testing checkout within the app; US brands only for the moment.
Facebook was storing your passwords in plain text & many employees had access. “My Facebook insider said access logs showed some 2,000 engineers or developers made approximately nine million internal queries for data elements that contained plain text user passwords.”
Did you know you can remove your last name from your public Facebook profile? (Plus 12 other Facebook facts & tricks)
Create great pins on Pinterest.
Pinterest files for IPO; admits that Google changes last year hurt it.
Backgrounder on short video sharing site TikTok.
Twitter Analytics has an events page that tips you off to annual events you may want to tweet about/around, under the Events tab in your Analytics.
ONLINE ADVERTISING (SEARCH ENGINES, SOCIAL MEDIA, & OTHERS)
Beginners’ guide to cost per click (CPC) ads - includes Google, Facebook, & Instagram.
Facebook & Instagram ad costs have rocketed since the site-wide outages on March 13.
Facebook’s advice on optimizing your Facebook ads.
Google fined by EU for blocking other ads.
STATS, DATA, OTHER TRACKING
Ecommerce reports in Google Analytics (for websites, not Etsy shops).
5 Instagram analytics tips.
ECOMMERCE NEWS, IDEAS, TRENDS
Microsoft considers competing with Shopify.
eBay states it uses artificial intelligence (AI) pretty much everywhere on its site, as do most big sites.
eBay adds Google Pay as a payment option.
Half of US households will belong to Amazon Prime this year. “Amazon Household, a program that allows different members of a single household, including teens, to have their own log-in for shopping and viewing of Prime content, was specifically cited by eMarketer as a factor driving adoption.”
Shopify is ending its MailChimp integration; interesting article here. “Mailchimp wrote a blog post stating that it asked Shopify to remove the Mailchimp integration from the Shopify marketplace. Mailchimp’s reasoning behind the move was due to the new term requiring partners to send back any data collected “on behalf of the merchant” back to Shopify. According to Joni Deus, director of partnerships at Mailchimp, that data (in Mailchimp’s eyes) doesn’t belong to Shopify.”
This is seen as a battle for data, a lot of which flows through APIs (APIs are how third party tools integrate with websites, like Etsy & label providers such as Shippo & Pirate Ship).
Square improves a bunch of ecommerce tools including social media integrations. They bought Weebly a year ago, & are using that to make changes to Square Online Store and Square for Retail.
BUSINESS & CONSUMER STUDIES, STATS & REPORTS; SOCIOLOGY & PSYCHOLOGY, CUSTOMER SERVICE
Tone is key to good customer service. I like the bit about answering apparently stupid questions - making the customer feel stupid (even if 99% of readers would agree the question was stupid) is usually not a good approach. But it can be hard to weed out negative tone. Other good quotes: “Directing the conversation away from the negative aspects and focusing instead on the proposed solution helps customers accept the situation and reduces the odds that they will be upset.” and “It almost doesn’t matter how good the news is; if it comes after “actually,” I feel like I was somehow wrong about something.”
Figuring out what motivates your customers.
Ecommerce customer service 101.
MISCELLANEOUS (INCLUDING HUMOUR)
Facial recognition software is scraping the photos you post online to improve their software. “Despite IBM’s assurances that Flickr users can opt out of the database, NBC News discovered that it’s almost impossible to get photos removed. … There may, however, be legal recourse in some jurisdictions thanks to the rise of privacy laws acknowledging the unique value of photos of people’s faces. Under Europe’s General Data Protection Regulation, photos are considered “sensitive personal information” if they are used to confirm an individual’s identity. Residents of Europe who don’t want their data included can ask IBM to delete it. If IBM doesn’t comply, they can complain to their country’s data protection authority, which, if the particular photos fall under the definition of “sensitive personal information,” can levy fines against companies that violate the law.
In the U.S., some states have laws that could be relevant. Under the Illinois Biometric Information Privacy Act, for example, it can be a violation to capture, store and share biometric information without a person’s written consent. According to the act, biometric information includes fingerprints, iris scans and face geometry.”
Cookie warnings are getting really complicated in some jurisdictions.
Microsoft killed Clippy again.
American drunk shopping continues to increase.
Posted April 8, 2019.
#seo#search engine optimization#etsynews#analytics#stats#social media#contentmarketing#ecommerce#smallbiz#CindyLouWho2NewsUpdates
2 notes
·
View notes
Text
How to Choose the Most Link-Worthy Data Source for Your Content
New Post has been published on https://tiptopreview.com/how-to-choose-the-most-link-worthy-data-source-for-your-content-2/
How to Choose the Most Link-Worthy Data Source for Your Content
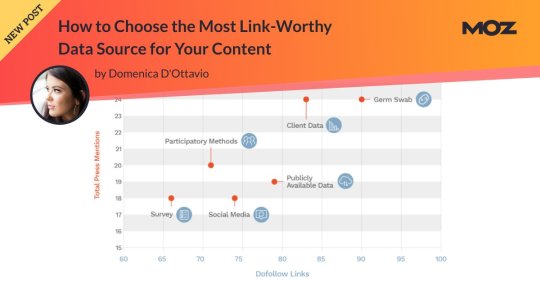
Fractl has produced thousands of content marketing campaigns across every topic, and for the past seven years, we’ve been keeping track of each and every campaign in order to refine and improve the content we produce on behalf of our clients.
In my last post for Moz, I explained how to set realistic digital PR expectations for your content based on your niche. In this topic, I want to dive a little bit deeper into the data and share insights about how the source of your content can be just as important in determining how your content will perform.
In this analysis, I looked at 1,474 client content campaigns across six different data source categories:
Client data
Social media
Participatory methods
Publicly available data
Survey
Germ swab
It’s important to note that there are countless other data sources that we use for content campaigns every day at Fractl that are not mentioned in this article. In this analysis, each category has at least 20 campaigns, while some categories have several hundred campaigns.
It’s also important to note that averages were collected by excluding upper outliers. For campaigns that went “viral” and performed well above the norm, we excluded them in the calculation so as not to skew the averages higher.
In addition to sharing link and press averages, I will also be walking through how to produce pressworthy, sharable content from each data source and providing examples.
Managing expectations across content types
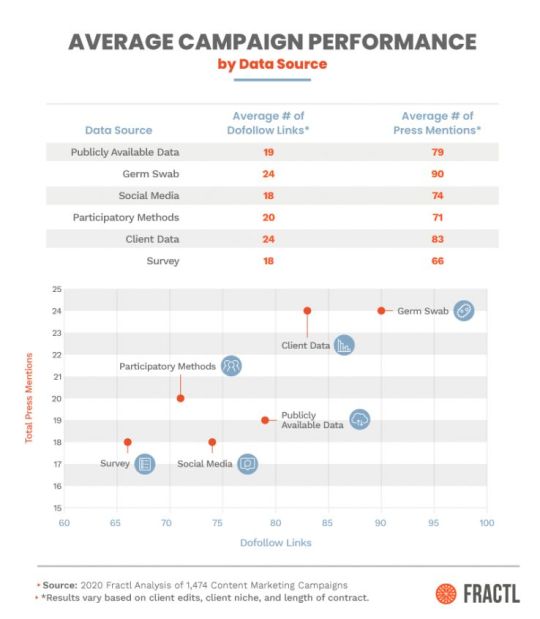
Across the entire sample of 1,474 campaigns, a project on average received 24 dofollow links and 89 press mentions in total.
A press mention is defined as any time the content campaign was mentioned on a publisher’s website.
There were some individual data source category averages that were on par with the sample average, while other categories deviated greatly from the sample average.
Publicly available data
For almost any niche out there, you can bet there is a publicly available data set available for use. Some examples include data from the CDC, the U.S. Census, colleges and universities, the WHO, and the TSA. The opportunities really are endless when it comes to using publicly available data as a methodology for your content.
While free data sets can be a treasure trove of information for your content, keep in mind that they’re not always the simplest to work with. They do require a lot of analysis to make sense of the massive amount of information in them, and to make the insights digestible for your audience.
Take for example a campaign we produced for a client called Neighborhood Names. The data was free from the US Census, but in order to make any sense of it, our researchers had to use QGIS, Python, text-mining, and phrasemachine (a text analysis API) just to narrow it down to what we were looking for.
And what were we looking for? Looking at neighborhood names across America seems boring at first, until you realize that certain words correspond to wealth.
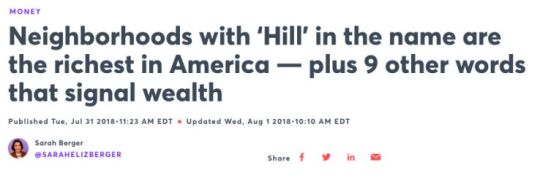
I was the outreach specialist for this project, and by using the wealth angle, I was able to secure two notable placements on CNBC as well as a press mention on MSN. The project quickly made its way around the internet after that, earning 76 dofollow links and 202 total press mentions by the end of our reporting period.
Survey
Unlike scouring the internet for free data, using a survey as a methodology can be more costly. That being said, there is one major advantage to using a survey to shape your content: you can find out anything you want.
While publicly available data will tell a story, it’s not always the story you want to tell, and that’s where surveys come in.
Of course, when it comes to surveys, anyone can create one without paying attention to research method best practices. That’s one of the problems we need to address. With “fake news” in the forefront of everyone’s minds in 2020, building trust with journalists and editors is of the utmost importance.
As content creators, we have a responsibility to ensure that content is not only attention-grabbing and entertaining, but also accurate and informative.
Survey campaigns, in particular, require you to analyze responses through a rigorous methodological lens. When collecting data for surveys, be sure to pay close attention to ethical upholdance, data validity, and fair visual representations.
Germ swab
From my own personal experience, germ swab content campaigns are the most fun, and often, the most disturbing. Fractl did some research a while back about the emotions that make content go viral, and oftentimes, germ swab campaigns hit all of the right emotions in the viral equation.
Negative emotions like disgust are often evoked when reviewing the results of germ swab campaigns. Our study found that when negative emotions are paired with emotions like anticipation or surprise, they can still achieve viral success (internet viral, not germ viral). What is more surprising than finding out the airplane tray table is dirtier than a toilet seat?
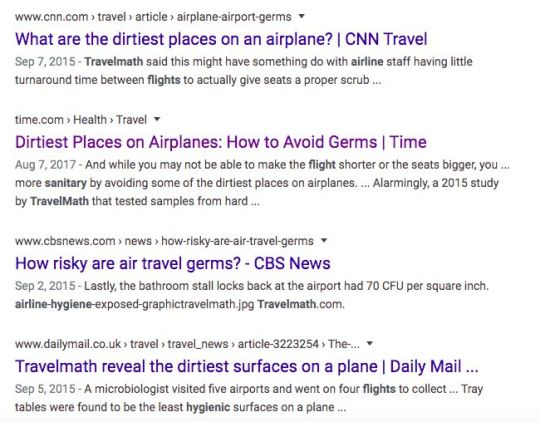
Publishers around the world seemed to think the content was surprising, too. This campaign performed above the norm for a typical content campaign earning 38 dofollows and 195 total press mentions — and this was before the COVID-19 pandemic.
Participatory methods
Participatory methods are campaigns that require active participation for the methodology. These are unique ideas — no two are alike. Some examples of campaigns that fall under the participatory methods category are when we had team members do a 30-day squat challenge, asked respondents to draw brand logos from memory, or when we literally drove from D.C. to NYC with a dash cam to record traffic violations.
These campaigns have a certain level of risk associated with them. They require a lot of upfront effort and planning without the promise of any return — and that’s scary for clients and for our team who put in tremendous effort to pull them off.
As you can see from the chart above, however, these ideas collectively performed right on par with other campaign types, and even better than survey methodologies for both the number of dofollow links and press mentions. In order to reap big benefits, it seems you need to be willing to take a big risk.
Social media
Social media as a data source is almost a no-brainer, right up there with survey methodologies and publicly available data sets. Unlike participatory methods campaigns, you don’t have to leave your computer in order to produce a campaign based on social media data.
Through our seven years of content creation, Fractl has produced campaigns based on data scrapes from Twitter, Instagram, Facebook, LinkedIn, Reddit, and more. From this experience, we know firsthand what kinds of social campaigns work and which ones fall flat.
The best thing about using social media as a source for content is that it can be applied to all verticals.
The biggest lesson we’ve learned from producing content based on social media data is that the methodology is typically subjective, so you need to keep the project lighthearted in nature in order to earn major coverage.
For example, we produced a campaign for a client in which we looked at Instagram posts with the hashtag #sexy and a geolocation. From this, we were able to glean the “sexiest” countries in the world as well as U.S. states.
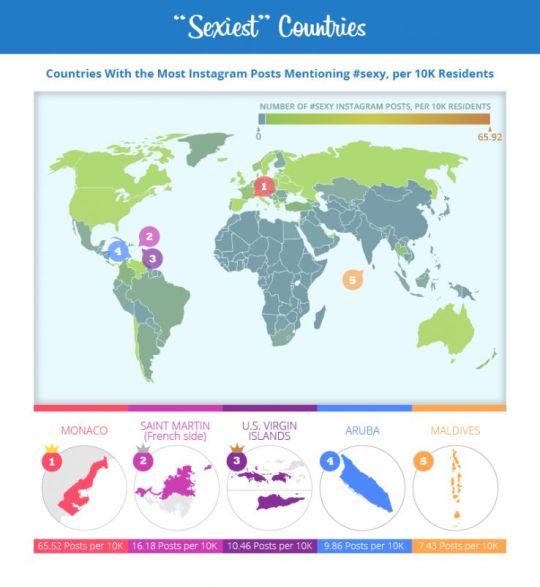
While it would be impossible to learn what the actual sexiest places in the world were, (what does that even mean?) we were able to produce a fun campaign that used geo-bait to appeal to lighthearted publishers, like Glamour, E! Online, Women’s Health, and Elite Daily.
Make sure that no matter the topic, whatever you produce contributes to an ongoing conversation. Statistics that don’t point to anything meaningful won’t be relevant for writers actually trying to add to the conversation.
Client data
Client data is often the most underappreciated data source for content marketers. You may be sitting on a wealth of actionable industry insights and not even know it.
You might think of internal data as only being useful for improving your internal processes at work, but it can also be valuable outside of your organization.
Unlike publicly available data, internal data is never-before-seen and 100% unique. Journalists eat this up because it means that you’re providing completely exclusive resources.
Think of this article, for example. This article is filled with data and insights that Fractl has gleaned after producing thousands of content marketing campaigns.
An added bonus of using internal data to craft your content is that, according to our analysis, it performs on par with surveys. Unlike surveys, though, it’s completely free.
Conclusion
No matter what methodology you’re using or vertical you’re creating content for, it’s important to realize that as content creators, we have an ethical and moral responsibility to create with an audience in mind.
With “fake news” on the forefront of everyone’s minds, building and maintaining trust with writers and editors is of the utmost importance.
All of the content you produce and promote must be assessed through a rigorous methodological lens to ensure that content is accurate and informative as well as eye-grabbing and entertaining.
Regardless of your methodology, if you don’t take the proper steps to make sure your data sources are accurate, you are contributing to the fake news epidemic.
Source link
0 notes
Text
As tech giants face Congressional investigation, states must step up regulatory oversight too
Tiffany Olson Kleemann Contributor
Tiffany Olson Kleemann is the chief executive officer of Distil Networks. She formerly served in executive roles at Symantec and FireEye and was deputy chief of staff for cybersecurity operations under President George W. Bush.
More posts by this contributor
Bots distorted the 2016 Election. Will the midterms be a sequel?
Congress has begun investigations into the power wielded by tech giants Amazon, Apple, Facebook, and Google – from their effect on the news media, to their impact on retail markets, to their handling of data. Unusual for these divided times, the concerns are bipartisan, with members of both parties suggesting that new legislation and regulation may be needed.
A number of big challenges are hurting consumers, including “serious breaches of privacy” and “loss of control of data,” Rep. David Cicilline, D-R.I., chairman of the House Antitrust Subcommittee, told CNBC.
This discussion of what Cicilline has called a “monopoly moment” is healthy and overdue. However, while Congress examines whether we should trust the tech titans with so much of our data and other assets, it would be great to see more urgency on another question: Can we trust the government itself with our data?
Federal and state government databases hold a treasure trove of sensitive, personal information that is used to collect taxes, administer benefits, register vehicles, or run elections. Not to mention the 434.2 million phone records on Americans that the National Security Agency collected last year, according to a government report.
Hackers, naturally, know that government sites are a rich target, and some of the largest cybersecurity breaches of recent years have taken place in the public sector.
WASHINGTON, DC – MARCH 24: A Department of Justice employee put up a poster of the seven indicted hackers prior to a news conference for announcing a law enforcement action March 24, 2016 in Washington, DC. A grand jury in the Southern District of New York has indicted seven Iranian who were employed by two Iran-based computer companies that performed work on behalf of the Iranian Government, on computer hacking charges related to their involvement in an extensive campaign of over 176 days of distributed denial of service (DDoS) attacks. (Photo by Alex Wong/Getty Images)
In two separate incidents in June 2015, the U.S. Office of Personnel Management discovered that attackers had stolen the Social Security numbers and other confidential information of 25.7 million current and former federal employees and contractors. The hackers’ haul even included 5.6 million fingerprints of job applicants who has undergone background investigations.
In 2016, the IRS said that 700,000 Social Security numbers were taken in a hack the year before.
In 2018, a “SamSam” ransomware attack shut down the city of Atlanta’s online systems, forcing the cancellation of court proceedings and preventing the collection of water bills and traffic fines. Last month, a ransomware assault has affected services in Baltimore and cost the city at least $18.2 million in lost or delayed revenue and direct restoration costs.
And then there are the foreign attempts to interfere with elections. U.S. officials have testified that Russian hackers targeted voting systems in 21 states in 2016, though no actual votes are believed to have been affected.
Since free and fair elections are a core tenet of our democracy, voter registration pages and election systems are the most sensitive areas of state and municipal web infrastructure. Election databases also contain personally identifiable information such as names, ages, and addresses. As my company’s experience with various state governments show, these systems are constantly under attack.
In fact, we’ve seen up to two-thirds of state election agencies’ website traffic consist of malicious bots searching for data to steal or scrape. Even more disturbingly, we have also seen spikes in automated traffic attacking the websites as registration deadlines approach. These spikes slow down the performance of back-end databases, compromising the agencies’ overall ability to effectively conduct elections.
This evidence shows that the existential threat to government data is every bit as important as the security and privacy concerns driving the congressional investigation of Amazon, Apple, Facebook, and Google. But is enough being done?
Voting booths in polling place. Image courtesy Getty Images
More than three years after the devastating attack on the U.S. Office of Personnel Management, a report by the General Accounting Office in November found that the agency had not implemented 29 of the 80 recommendations the government’s in-house auditor had made to shore up its cyber defenses.
In Atlanta, an audit determined that leading up to the ransomware attack, the city had ignored repeated warnings about flaws in its security posture, including a failure to address 1,500 to 2,000 severe vulnerabilities that the city’s Information Management and the Office of Information Security had identified.
Where control of data is concerned, it’s vital that the federal and state governments look themselves in the mirror just as hard as Congress is now assessing the tech giants. A few specific recommendations:
Government agencies at all levels should conduct an exhaustive review of their cyber security capabilities and hold leaders personally responsible for ensuring they are up to snuff for constantly evolving threats.
Beyond investigating the practices of a few companies, Congress also should focus energy on a long-overdue update of the Computer Fraud and Abuse Act, a 33-year-old law that makes it unlawful to break into a computer to access or alter information and, astoundingly, still serves as a legal guidepost in today’s new landscape of bots, malware, ransomware and other malicious attacks.
The Trump administration should make sure to follow through with its May 2 executive order on cyber defense that promised to “grow the cybersecurity capability of the United States Government, increase integration of the federal cybersecurity workforce, and strengthen the skills of federal information technology and cybersecurity practitioners.” It also called for a “cybersecurity rotational assignment program” within the federal government that “will serve as a mechanism for knowledge transfer and a development program for cybersecurity practitioners.”
An important discussion is happening on Capitol Hill about the influence of Amazon, Apple, Facebook, and Google in our lives and society. It would be hypocritical, however, to lose sight of how much of our data sits in government computer systems and that it also faces serious threat.
0 notes
Text
As tech giants face Congressional investigation, states must step up regulatory oversight too
Tiffany Olson Kleemann Contributor
Tiffany Olson Kleemann is the chief executive officer of Distil Networks. She formerly served in executive roles at Symantec and FireEye and was deputy chief of staff for cybersecurity operations under President George W. Bush.
Congress has begun investigations into the power wielded by tech giants Amazon, Apple, Facebook, and Google – from their effect on the news media, to their impact on retail markets, to their handling of data. Unusual for these divided times, the concerns are bipartisan, with members of both parties suggesting that new legislation and regulation may be needed.
A number of big challenges are hurting consumers, including “serious breaches of privacy” and “loss of control of data,” Rep. David Cicilline, D-R.I., chairman of the House Antitrust Subcommittee, told CNBC.
This discussion of what Cicilline has called a “monopoly moment” is healthy and overdue. However, while Congress examines whether we should trust the tech titans with so much of our data and other assets, it would be great to see more urgency on another question: Can we trust the government itself with our data?
Federal and state government databases hold a treasure trove of sensitive, personal information that is used to collect taxes, administer benefits, register vehicles, or run elections. Not to mention the 434.2 million phone records on Americans that the National Security Agency collected last year, according to a government report.
Hackers, naturally, know that government sites are a rich target, and some of the largest cybersecurity breaches of recent years have taken place in the public sector.
WASHINGTON, DC – MARCH 24: A Department of Justice employee put up a poster of the seven indicted hackers prior to a news conference for announcing a law enforcement action March 24, 2016 in Washington, DC. A grand jury in the Southern District of New York has indicted seven Iranian who were employed by two Iran-based computer companies that performed work on behalf of the Iranian Government, on computer hacking charges related to their involvement in an extensive campaign of over 176 days of distributed denial of service (DDoS) attacks. (Photo by Alex Wong/Getty Images)
In two separate incidents in June 2015, the U.S. Office of Personnel Management discovered that attackers had stolen the Social Security numbers and other confidential information of 25.7 million current and former federal employees and contractors. The hackers’ haul even included 5.6 million fingerprints of job applicants who has undergone background investigations.
In 2016, the IRS said that 700,000 Social Security numbers were taken in a hack the year before.
In 2018, a “SamSam” ransomware attack shut down the city of Atlanta’s online systems, forcing the cancellation of court proceedings and preventing the collection of water bills and traffic fines. Last month, a ransomware assault has affected services in Baltimore and cost the city at least $18.2 million in lost or delayed revenue and direct restoration costs.
And then there are the foreign attempts to interfere with elections. U.S. officials have testified that Russian hackers targeted voting systems in 21 states in 2016, though no actual votes are believed to have been affected.
Since free and fair elections are a core tenet of our democracy, voter registration pages and election systems are the most sensitive areas of state and municipal web infrastructure. Election databases also contain personally identifiable information such as names, ages, and addresses. As my company’s experience with various state governments show, these systems are constantly under attack.
In fact, we’ve seen up to two-thirds of state election agencies’ website traffic consist of malicious bots searching for data to steal or scrape. Even more disturbingly, we have also seen spikes in automated traffic attacking the websites as registration deadlines approach. These spikes slow down the performance of back-end databases, compromising the agencies’ overall ability to effectively conduct elections.
This evidence shows that the existential threat to government data is every bit as important as the security and privacy concerns driving the congressional investigation of Amazon, Apple, Facebook, and Google. But is enough being done?
Voting booths in polling place. Image courtesy Getty Images
More than three years after the devastating attack on the U.S. Office of Personnel Management, a report by the General Accounting Office in November found that the agency had not implemented 29 of the 80 recommendations the government’s in-house auditor had made to shore up its cyber defenses.
In Atlanta, an audit determined that leading up to the ransomware attack, the city had ignored repeated warnings about flaws in its security posture, including a failure to address 1,500 to 2,000 severe vulnerabilities that the city’s Information Management and the Office of Information Security had identified.
Where control of data is concerned, it’s vital that the federal and state governments look themselves in the mirror just as hard as Congress is now assessing the tech giants. A few specific recommendations:
Government agencies at all levels should conduct an exhaustive review of their cyber security capabilities and hold leaders personally responsible for ensuring they are up to snuff for constantly evolving threats.
Beyond investigating the practices of a few companies, Congress also should focus energy on a long-overdue update of the Computer Fraud and Abuse Act, a 33-year-old law that makes it unlawful to break into a computer to access or alter information and, astoundingly, still serves as a legal guidepost in today’s new landscape of bots, malware, ransomware and other malicious attacks.
The Trump administration should make sure to follow through with its May 2 executive order on cyber defense that promised to “grow the cybersecurity capability of the United States Government, increase integration of the federal cybersecurity workforce, and strengthen the skills of federal information technology and cybersecurity practitioners.” It also called for a “cybersecurity rotational assignment program” within the federal government that “will serve as a mechanism for knowledge transfer and a development program for cybersecurity practitioners.”
An important discussion is happening on Capitol Hill about the influence of Amazon, Apple, Facebook, and Google in our lives and society. It would be hypocritical, however, to lose sight of how much of our data sits in government computer systems and that it also faces serious threat.
from Facebook – TechCrunch https://ift.tt/2JYEMj1 via IFTTT
0 notes
Text
Unriddled: Apple's Latest MacBook, Another Facebook Data Loophole, and More Tech News You Need
Welcome one, welcome all to another Wednesday: the day that marks the halfway point -- almost -- to the weekend.
As we find ourselves halfway through July and grasping tightly to the weeks of summer that remain, we know you don't have a ton of time to devour news. So, in keeping with tradition -- we'll keep this week's "Unriddled" quick.
It's our Wednesday tech news roundup, and we're breaking it down.
Unriddled: The Tech News You Need
1. Apple Releases a New Macbook Pro
Apple announced last week the latest release in its MacBook Pro lineup, calling it "the most advanced Mac notebook ever." Among its news features, the company says, are faster computing, an improved Retina display, and the ability to prompt Apple's voice assistant with verbal "Hey Siri" commands -- and, according to some early users, a quieter keyboard. But there may be more beneath that (hushed) surface, with rumors floating that the subdued typing volume is actually a way of masking the manufacturer's known keyboard reliability issues. Dieter Bohn of The Verge shares more first impressions. Read full story >>
2. Facebook Privacy Loophole Discovered in "Closed" Groups
CNBC reported last week that Facebook has closed a loophole that allowed the identities of members of closed, private groups on the platform to be scraped with the use of a Chrome browser plug-in. The issue was discovered when the moderator of a closed group came upon the Grouply.io browser extension, which allows third parties (like marketers) to harvest private member information like names, employers, and locations, among others. A Facebook spokesperson told CNBC that the extension has been shut down. Read full story >>
3. Uber Steps Up Its Background Checks
Uber is reinforcing its efforts around safety, telling Axios that it will now conduct ongoing background checks on drivers, rather than performing them on a one-time occasion. Partnering with background check provider Checkr and safety data company Appriss, this move is the latest of Uber's efforts, largely under CEO Dara Khosrowshahi, to improve the company's reputation, especially when it comes to rider safety. The announcement of these efforts was shortly followed by reports that the company is under investigation by the U.S. Equal Employment Opportunity Commission for gender inequity. Read full story >>
4. The Tech Giants Go to Washington (Again)
Policy representatives from Facebook, YouTube, and Twitter appeared before the House Judiciary Committee in a hearing on social media filtering practices -- the second one to take place this year. All three were facing allegations that they filter or suppress conservative content -- but little of that particular topic was actually discussed during the hearing. Tony Romm of The Washington Post has more. Read full story >>
5. Twitter Follower Counts Drop
Following the previous week's report that Twitter has been conducting sweeping account suspensions, the company announced last week that it would delete locked accounts from total user follower counts, causing many of them to drop. Read full story >>
6. The Genius Marketing of HQ Trivia
In the world of tech, it's hard to go too long without hearing a reference to the HQ Trivia app. But what's all the hype about -- and what can we learn from its success? Read full story >>
That’s all for today. Until next week, feel free to weigh in on Twitter to ask us your tech news questions, or to let us know what kind of events and topics you'd like us to cover.
from Marketing https://blog.hubspot.com/marketing/new-macbook-facebook-data-tech-news
0 notes
Text
How to Choose the Most Link-Worthy Data Source for Your Content Posted by Domenica
Posted by Domenica Fractl has produced thousands of content marketing campaigns across every topic, and for the past seven years, we’ve been keeping track of each and every campaign in order to refine and improve the content we produce on behalf of our clients. In my last post for Moz, I explained how to set realistic digital PR expectations for your content based on your niche. In this topic, I want to dive a little bit deeper into the data and share insights about how the source of your content can be just as important in determining how your content will perform. In this analysis, I looked at 1,474 client content campaigns across six different data source categories:
Client data
Social media
Participatory methods
Publicly available data
Survey
Germ swab
It’s important to note that there are countless other data sources that we use for content campaigns every day at Fractl that are not mentioned in this article. In this analysis, each category has at least 20 campaigns, while some categories have several hundred campaigns. It’s also important to note that averages were collected by excluding upper outliers. For campaigns that went “viral” and performed well above the norm, we excluded them in the calculation so as not to skew the averages higher. In addition to sharing link and press averages, I will also be walking through how to produce pressworthy, sharable content from each data source and providing examples.
Managing expectations across content types
Across the entire sample of 1,474 campaigns, a project on average received 24 dofollow links and 89 press mentions in total. A press mention is defined as any time the content campaign was mentioned on a publisher’s website. There were some individual data source category averages that were on par with the sample average, while other categories deviated greatly from the sample average.
Publicly available data
For almost any niche out there, you can bet there is a publicly available data set available for use. Some examples include data from the CDC, the U.S. Census, colleges and universities, the WHO, and the TSA. The opportunities really are endless when it comes to using publicly available data as a methodology for your content. While free data sets can be a treasure trove of information for your content, keep in mind that they’re not always the simplest to work with. They do require a lot of analysis to make sense of the massive amount of information in them, and to make the insights digestible for your audience. Take for example a campaign we produced for a client called Neighborhood Names. The data was free from the US Census, but in order to make any sense of it, our researchers had to use QGIS, Python, text-mining, and phrasemachine (a text analysis API) just to narrow it down to what we were looking for. And what were we looking for? Looking at neighborhood names across America seems boring at first, until you realize that certain words correspond to wealth. I was the outreach specialist for this project, and by using the wealth angle, I was able to secure two notable placements on CNBC as well as a press mention on MSN. The project quickly made its way around the internet after that, earning 76 dofollow links and 202 total press mentions by the end of our reporting period.
Survey
Unlike scouring the internet for free data, using a survey as a methodology can be more costly. That being said, there is one major advantage to using a survey to shape your content: you can find out anything you want. While publicly available data will tell a story, it’s not always the story you want to tell, and that’s where surveys come in. Of course, when it comes to surveys, anyone can create one without paying attention to research method best practices. That's one of the problems we need to address. With “fake news” in the forefront of everyone’s minds in 2020, building trust with journalists and editors is of the utmost importance. As content creators, we have a responsibility to ensure that content is not only attention-grabbing and entertaining, but also accurate and informative. Survey campaigns, in particular, require you to analyze responses through a rigorous methodological lens. When collecting data for surveys, be sure to pay close attention to ethical upholdance, data validity, and fair visual representations.
Germ swab
From my own personal experience, germ swab content campaigns are the most fun, and often, the most disturbing. Fractl did some research a while back about the emotions that make content go viral, and oftentimes, germ swab campaigns hit all of the right emotions in the viral equation. Negative emotions like disgust are often evoked when reviewing the results of germ swab campaigns. Our study found that when negative emotions are paired with emotions like anticipation or surprise, they can still achieve viral success (internet viral, not germ viral). What is more surprising than finding out the airplane tray table is dirtier than a toilet seat? Publishers around the world seemed to think the content was surprising, too. This campaign performed above the norm for a typical content campaign earning 38 dofollows and 195 total press mentions — and this was before the COVID-19 pandemic.
Participatory methods
Participatory methods are campaigns that require active participation for the methodology. These are unique ideas — no two are alike. Some examples of campaigns that fall under the participatory methods category are when we had team members do a 30-day squat challenge, asked respondents to draw brand logos from memory, or when we literally drove from D.C. to NYC with a dash cam to record traffic violations. These campaigns have a certain level of risk associated with them. They require a lot of upfront effort and planning without the promise of any return — and that’s scary for clients and for our team who put in tremendous effort to pull them off. As you can see from the chart above, however, these ideas collectively performed right on par with other campaign types, and even better than survey methodologies for both the number of dofollow links and press mentions. In order to reap big benefits, it seems you need to be willing to take a big risk.
Social media
Social medIa as a data source is almost a no-brainer, right up there with survey methodologies and publicly available data sets. Unlike participatory methods campaigns, you don’t have to leave your computer in order to produce a campaign based on social media data. Through our seven years of content creation, Fractl has produced campaigns based on data scrapes from Twitter, Instagram, Facebook, LinkedIn, Reddit, and more. From this experience, we know firsthand what kinds of social campaigns work and which ones fall flat. The best thing about using social media as a source for content is that it can be applied to all verticals. The biggest lesson we’ve learned from producing content based on social media data is that the methodology is typically subjective, so you need to keep the project lighthearted in nature in order to earn major coverage. For example, we produced a campaign for a client in which we looked at Instagram posts with the hashtag #sexy and a geolocation. From this, we were able to glean the “sexiest” countries in the world as well as U.S. states. While it would be impossible to learn what the actual sexiest places in the world were, (what does that even mean?) we were able to produce a fun campaign that used geo-bait to appeal to lighthearted publishers, like Glamour, E! Online, Women's Health, and Elite Daily. Make sure that no matter the topic, whatever you produce contributes to an ongoing conversation. Statistics that don’t point to anything meaningful won’t be relevant for writers actually trying to add to the conversation.
Client data
Client data is often the most underappreciated data source for content marketers. You may be sitting on a wealth of actionable industry insights and not even know it. You might think of internal data as only being useful for improving your internal processes at work, but it can also be valuable outside of your organization. Unlike publicly available data, internal data is never-before-seen and 100% unique. Journalists eat this up because it means that you’re providing completely exclusive resources. Think of this article, for example. This article is filled with data and insights that Fractl has gleaned after producing thousands of content marketing campaigns. An added bonus of using internal data to craft your content is that, according to our analysis, it performs on par with surveys. Unlike surveys, though, it’s completely free.
Conclusion
No matter what methodology you’re using or vertical you’re creating content for, it’s important to realize that as content creators, we have an ethical and moral responsibility to create with an audience in mind. With “fake news” on the forefront of everyone’s minds, building and maintaining trust with writers and editors is of the utmost importance. All of the content you produce and promote must be assessed through a rigorous methodological lens to ensure that content is accurate and informative as well as eye-grabbing and entertaining. Regardless of your methodology, if you don’t take the proper steps to make sure your data sources are accurate, you are contributing to the fake news epidemic. Sign up for The Moz Top 10, a semimonthly mailer updating you on the top ten hottest pieces of SEO news, tips, and rad links uncovered by the Moz team. Think of it as your exclusive digest of stuff you don't have time to hunt down but want to read!
https://www.businesscreatorplus.com/how-to-choose-the-most-link-worthy-data-source-for-your-content/
0 notes
Text
How to Choose the Most Link-Worthy Data Source for Your Content
Posted by Domenica
Fractl has produced thousands of content marketing campaigns across every topic, and for the past seven years, we’ve been keeping track of each and every campaign in order to refine and improve the content we produce on behalf of our clients.
In my last post for Moz, I explained how to set realistic digital PR expectations for your content based on your niche. In this topic, I want to dive a little bit deeper into the data and share insights about how the source of your content can be just as important in determining how your content will perform.
In this analysis, I looked at 1,474 client content campaigns across six different data source categories:
Client data
Social media
Participatory methods
Publicly available data
Survey
Germ swab
It’s important to note that there are countless other data sources that we use for content campaigns every day at Fractl that are not mentioned in this article. In this analysis, each category has at least 20 campaigns, while some categories have several hundred campaigns.
It’s also important to note that averages were collected by excluding upper outliers. For campaigns that went “viral” and performed well above the norm, we excluded them in the calculation so as not to skew the averages higher.
In addition to sharing link and press averages, I will also be walking through how to produce pressworthy, sharable content from each data source and providing examples.
Managing expectations across content types
Across the entire sample of 1,474 campaigns, a project on average received 24 dofollow links and 89 press mentions in total.
A press mention is defined as any time the content campaign was mentioned on a publisher’s website.
There were some individual data source category averages that were on par with the sample average, while other categories deviated greatly from the sample average.
Publicly available data
For almost any niche out there, you can bet there is a publicly available data set available for use. Some examples include data from the CDC, the U.S. Census, colleges and universities, the WHO, and the TSA. The opportunities really are endless when it comes to using publicly available data as a methodology for your content.
While free data sets can be a treasure trove of information for your content, keep in mind that they’re not always the simplest to work with. They do require a lot of analysis to make sense of the massive amount of information in them, and to make the insights digestible for your audience.
Take for example a campaign we produced for a client called Neighborhood Names. The data was free from the US Census, but in order to make any sense of it, our researchers had to use QGIS, Python, text-mining, and phrasemachine (a text analysis API) just to narrow it down to what we were looking for.
And what were we looking for? Looking at neighborhood names across America seems boring at first, until you realize that certain words correspond to wealth.
I was the outreach specialist for this project, and by using the wealth angle, I was able to secure two notable placements on CNBC as well as a press mention on MSN. The project quickly made its way around the internet after that, earning 76 dofollow links and 202 total press mentions by the end of our reporting period.
Survey
Unlike scouring the internet for free data, using a survey as a methodology can be more costly. That being said, there is one major advantage to using a survey to shape your content: you can find out anything you want.
While publicly available data will tell a story, it’s not always the story you want to tell, and that’s where surveys come in.
Of course, when it comes to surveys, anyone can create one without paying attention to research method best practices. That's one of the problems we need to address. With “fake news” in the forefront of everyone’s minds in 2020, building trust with journalists and editors is of the utmost importance.
As content creators, we have a responsibility to ensure that content is not only attention-grabbing and entertaining, but also accurate and informative.
Survey campaigns, in particular, require you to analyze responses through a rigorous methodological lens. When collecting data for surveys, be sure to pay close attention to ethical upholdance, data validity, and fair visual representations.
Germ swab
From my own personal experience, germ swab content campaigns are the most fun, and often, the most disturbing. Fractl did some research a while back about the emotions that make content go viral, and oftentimes, germ swab campaigns hit all of the right emotions in the viral equation.
Negative emotions like disgust are often evoked when reviewing the results of germ swab campaigns. Our study found that when negative emotions are paired with emotions like anticipation or surprise, they can still achieve viral success (internet viral, not germ viral). What is more surprising than finding out the airplane tray table is dirtier than a toilet seat?
Publishers around the world seemed to think the content was surprising, too. This campaign performed above the norm for a typical content campaign earning 38 dofollows and 195 total press mentions — and this was before the COVID-19 pandemic.
Participatory methods
Participatory methods are campaigns that require active participation for the methodology. These are unique ideas — no two are alike. Some examples of campaigns that fall under the participatory methods category are when we had team members do a 30-day squat challenge, asked respondents to draw brand logos from memory, or when we literally drove from D.C. to NYC with a dash cam to record traffic violations.
These campaigns have a certain level of risk associated with them. They require a lot of upfront effort and planning without the promise of any return — and that’s scary for clients and for our team who put in tremendous effort to pull them off.
As you can see from the chart above, however, these ideas collectively performed right on par with other campaign types, and even better than survey methodologies for both the number of dofollow links and press mentions. In order to reap big benefits, it seems you need to be willing to take a big risk.
Social media
Social medIa as a data source is almost a no-brainer, right up there with survey methodologies and publicly available data sets. Unlike participatory methods campaigns, you don’t have to leave your computer in order to produce a campaign based on social media data.
Through our seven years of content creation, Fractl has produced campaigns based on data scrapes from Twitter, Instagram, Facebook, LinkedIn, Reddit, and more. From this experience, we know firsthand what kinds of social campaigns work and which ones fall flat.
The best thing about using social media as a source for content is that it can be applied to all verticals.
The biggest lesson we’ve learned from producing content based on social media data is that the methodology is typically subjective, so you need to keep the project lighthearted in nature in order to earn major coverage.
For example, we produced a campaign for a client in which we looked at Instagram posts with the hashtag #sexy and a geolocation. From this, we were able to glean the “sexiest” countries in the world as well as U.S. states.
While it would be impossible to learn what the actual sexiest places in the world were, (what does that even mean?) we were able to produce a fun campaign that used geo-bait to appeal to lighthearted publishers, like Glamour, E! Online, Women's Health, and Elite Daily.
Make sure that no matter the topic, whatever you produce contributes to an ongoing conversation. Statistics that don’t point to anything meaningful won’t be relevant for writers actually trying to add to the conversation.
Client data
Client data is often the most underappreciated data source for content marketers. You may be sitting on a wealth of actionable industry insights and not even know it.
You might think of internal data as only being useful for improving your internal processes at work, but it can also be valuable outside of your organization.
Unlike publicly available data, internal data is never-before-seen and 100% unique. Journalists eat this up because it means that you’re providing completely exclusive resources.
Think of this article, for example. This article is filled with data and insights that Fractl has gleaned after producing thousands of content marketing campaigns.
An added bonus of using internal data to craft your content is that, according to our analysis, it performs on par with surveys. Unlike surveys, though, it’s completely free.
Conclusion
No matter what methodology you’re using or vertical you’re creating content for, it’s important to realize that as content creators, we have an ethical and moral responsibility to create with an audience in mind.
With “fake news” on the forefront of everyone’s minds, building and maintaining trust with writers and editors is of the utmost importance.
All of the content you produce and promote must be assessed through a rigorous methodological lens to ensure that content is accurate and informative as well as eye-grabbing and entertaining.
Regardless of your methodology, if you don’t take the proper steps to make sure your data sources are accurate, you are contributing to the fake news epidemic.
Sign up for The Moz Top 10, a semimonthly mailer updating you on the top ten hottest pieces of SEO news, tips, and rad links uncovered by the Moz team. Think of it as your exclusive digest of stuff you don't have time to hunt down but want to read!
via Blogger https://ift.tt/2NDNYf0 #blogger #bloggingtips #bloggerlife #bloggersgetsocial #ontheblog #writersofinstagram #writingprompt #instapoetry #writerscommunity #writersofig #writersblock #writerlife #writtenword #instawriters #spilledink #wordgasm #creativewriting #poetsofinstagram #blackoutpoetry #poetsofig
0 notes
Text
How to Choose the Most Link-Worthy Data Source for Your Content
Posted by Domenica
Fractl has produced thousands of content marketing campaigns across every topic, and for the past seven years, we’ve been keeping track of each and every campaign in order to refine and improve the content we produce on behalf of our clients.
In my last post for Moz, I explained how to set realistic digital PR expectations for your content based on your niche. In this topic, I want to dive a little bit deeper into the data and share insights about how the source of your content can be just as important in determining how your content will perform.
In this analysis, I looked at 1,474 client content campaigns across six different data source categories:
Client data
Social media
Participatory methods
Publicly available data
Survey
Germ swab
It’s important to note that there are countless other data sources that we use for content campaigns every day at Fractl that are not mentioned in this article. In this analysis, each category has at least 20 campaigns, while some categories have several hundred campaigns.
It’s also important to note that averages were collected by excluding upper outliers. For campaigns that went “viral” and performed well above the norm, we excluded them in the calculation so as not to skew the averages higher.
In addition to sharing link and press averages, I will also be walking through how to produce pressworthy, sharable content from each data source and providing examples.
Managing expectations across content types
Across the entire sample of 1,474 campaigns, a project on average received 24 dofollow links and 89 press mentions in total.
A press mention is defined as any time the content campaign was mentioned on a publisher’s website.
There were some individual data source category averages that were on par with the sample average, while other categories deviated greatly from the sample average.
Publicly available data
For almost any niche out there, you can bet there is a publicly available data set available for use. Some examples include data from the CDC, the U.S. Census, colleges and universities, the WHO, and the TSA. The opportunities really are endless when it comes to using publicly available data as a methodology for your content.
While free data sets can be a treasure trove of information for your content, keep in mind that they’re not always the simplest to work with. They do require a lot of analysis to make sense of the massive amount of information in them, and to make the insights digestible for your audience.
Take for example a campaign we produced for a client called Neighborhood Names. The data was free from the US Census, but in order to make any sense of it, our researchers had to use QGIS, Python, text-mining, and phrasemachine (a text analysis API) just to narrow it down to what we were looking for.
And what were we looking for? Looking at neighborhood names across America seems boring at first, until you realize that certain words correspond to wealth.
I was the outreach specialist for this project, and by using the wealth angle, I was able to secure two notable placements on CNBC as well as a press mention on MSN. The project quickly made its way around the internet after that, earning 76 dofollow links and 202 total press mentions by the end of our reporting period.
Survey
Unlike scouring the internet for free data, using a survey as a methodology can be more costly. That being said, there is one major advantage to using a survey to shape your content: you can find out anything you want.
While publicly available data will tell a story, it’s not always the story you want to tell, and that’s where surveys come in.
Of course, when it comes to surveys, anyone can create one without paying attention to research method best practices. That's one of the problems we need to address. With “fake news” in the forefront of everyone’s minds in 2020, building trust with journalists and editors is of the utmost importance.
As content creators, we have a responsibility to ensure that content is not only attention-grabbing and entertaining, but also accurate and informative.
Survey campaigns, in particular, require you to analyze responses through a rigorous methodological lens. When collecting data for surveys, be sure to pay close attention to ethical upholdance, data validity, and fair visual representations.
Germ swab
From my own personal experience, germ swab content campaigns are the most fun, and often, the most disturbing. Fractl did some research a while back about the emotions that make content go viral, and oftentimes, germ swab campaigns hit all of the right emotions in the viral equation.
Negative emotions like disgust are often evoked when reviewing the results of germ swab campaigns. Our study found that when negative emotions are paired with emotions like anticipation or surprise, they can still achieve viral success (internet viral, not germ viral). What is more surprising than finding out the airplane tray table is dirtier than a toilet seat?
Publishers around the world seemed to think the content was surprising, too. This campaign performed above the norm for a typical content campaign earning 38 dofollows and 195 total press mentions — and this was before the COVID-19 pandemic.
Participatory methods
Participatory methods are campaigns that require active participation for the methodology. These are unique ideas — no two are alike. Some examples of campaigns that fall under the participatory methods category are when we had team members do a 30-day squat challenge, asked respondents to draw brand logos from memory, or when we literally drove from D.C. to NYC with a dash cam to record traffic violations.
These campaigns have a certain level of risk associated with them. They require a lot of upfront effort and planning without the promise of any return — and that’s scary for clients and for our team who put in tremendous effort to pull them off.
As you can see from the chart above, however, these ideas collectively performed right on par with other campaign types, and even better than survey methodologies for both the number of dofollow links and press mentions. In order to reap big benefits, it seems you need to be willing to take a big risk.
Social media
Social medIa as a data source is almost a no-brainer, right up there with survey methodologies and publicly available data sets. Unlike participatory methods campaigns, you don’t have to leave your computer in order to produce a campaign based on social media data.
Through our seven years of content creation, Fractl has produced campaigns based on data scrapes from Twitter, Instagram, Facebook, LinkedIn, Reddit, and more. From this experience, we know firsthand what kinds of social campaigns work and which ones fall flat.
The best thing about using social media as a source for content is that it can be applied to all verticals.
The biggest lesson we’ve learned from producing content based on social media data is that the methodology is typically subjective, so you need to keep the project lighthearted in nature in order to earn major coverage.
For example, we produced a campaign for a client in which we looked at Instagram posts with the hashtag #sexy and a geolocation. From this, we were able to glean the “sexiest” countries in the world as well as U.S. states.
While it would be impossible to learn what the actual sexiest places in the world were, (what does that even mean?) we were able to produce a fun campaign that used geo-bait to appeal to lighthearted publishers, like Glamour, E! Online, Women's Health, and Elite Daily.
Make sure that no matter the topic, whatever you produce contributes to an ongoing conversation. Statistics that don’t point to anything meaningful won’t be relevant for writers actually trying to add to the conversation.
Client data
Client data is often the most underappreciated data source for content marketers. You may be sitting on a wealth of actionable industry insights and not even know it.
You might think of internal data as only being useful for improving your internal processes at work, but it can also be valuable outside of your organization.
Unlike publicly available data, internal data is never-before-seen and 100% unique. Journalists eat this up because it means that you’re providing completely exclusive resources.
Think of this article, for example. This article is filled with data and insights that Fractl has gleaned after producing thousands of content marketing campaigns.
An added bonus of using internal data to craft your content is that, according to our analysis, it performs on par with surveys. Unlike surveys, though, it’s completely free.
Conclusion
No matter what methodology you’re using or vertical you’re creating content for, it’s important to realize that as content creators, we have an ethical and moral responsibility to create with an audience in mind.
With “fake news” on the forefront of everyone’s minds, building and maintaining trust with writers and editors is of the utmost importance.
All of the content you produce and promote must be assessed through a rigorous methodological lens to ensure that content is accurate and informative as well as eye-grabbing and entertaining.
Regardless of your methodology, if you don’t take the proper steps to make sure your data sources are accurate, you are contributing to the fake news epidemic.
Sign up for The Moz Top 10, a semimonthly mailer updating you on the top ten hottest pieces of SEO news, tips, and rad links uncovered by the Moz team. Think of it as your exclusive digest of stuff you don't have time to hunt down but want to read!
from The Moz Blog https://ift.tt/2BLLSab via IFTTT
0 notes
Text
How to Choose the Most Link-Worthy Data Source for Your Content
Posted by Domenica
Fractl has produced thousands of content marketing campaigns across every topic, and for the past seven years, we’ve been keeping track of each and every campaign in order to refine and improve the content we produce on behalf of our clients.
In my last post for Moz, I explained how to set realistic digital PR expectations for your content based on your niche. In this topic, I want to dive a little bit deeper into the data and share insights about how the source of your content can be just as important in determining how your content will perform.
In this analysis, I looked at 1,474 client content campaigns across six different data source categories:
Client data
Social media
Participatory methods
Publicly available data
Survey
Germ swab
It’s important to note that there are countless other data sources that we use for content campaigns every day at Fractl that are not mentioned in this article. In this analysis, each category has at least 20 campaigns, while some categories have several hundred campaigns.
It’s also important to note that averages were collected by excluding upper outliers. For campaigns that went “viral” and performed well above the norm, we excluded them in the calculation so as not to skew the averages higher.
In addition to sharing link and press averages, I will also be walking through how to produce pressworthy, sharable content from each data source and providing examples.
Managing expectations across content types
Across the entire sample of 1,474 campaigns, a project on average received 24 dofollow links and 89 press mentions in total.
A press mention is defined as any time the content campaign was mentioned on a publisher’s website.
There were some individual data source category averages that were on par with the sample average, while other categories deviated greatly from the sample average.
Publicly available data
For almost any niche out there, you can bet there is a publicly available data set available for use. Some examples include data from the CDC, the U.S. Census, colleges and universities, the WHO, and the TSA. The opportunities really are endless when it comes to using publicly available data as a methodology for your content.
While free data sets can be a treasure trove of information for your content, keep in mind that they’re not always the simplest to work with. They do require a lot of analysis to make sense of the massive amount of information in them, and to make the insights digestible for your audience.
Take for example a campaign we produced for a client called Neighborhood Names. The data was free from the US Census, but in order to make any sense of it, our researchers had to use QGIS, Python, text-mining, and phrasemachine (a text analysis API) just to narrow it down to what we were looking for.
And what were we looking for? Looking at neighborhood names across America seems boring at first, until you realize that certain words correspond to wealth.
I was the outreach specialist for this project, and by using the wealth angle, I was able to secure two notable placements on CNBC as well as a press mention on MSN. The project quickly made its way around the internet after that, earning 76 dofollow links and 202 total press mentions by the end of our reporting period.
Survey
Unlike scouring the internet for free data, using a survey as a methodology can be more costly. That being said, there is one major advantage to using a survey to shape your content: you can find out anything you want.
While publicly available data will tell a story, it’s not always the story you want to tell, and that’s where surveys come in.
Of course, when it comes to surveys, anyone can create one without paying attention to research method best practices. That's one of the problems we need to address. With “fake news” in the forefront of everyone’s minds in 2020, building trust with journalists and editors is of the utmost importance.
As content creators, we have a responsibility to ensure that content is not only attention-grabbing and entertaining, but also accurate and informative.
Survey campaigns, in particular, require you to analyze responses through a rigorous methodological lens. When collecting data for surveys, be sure to pay close attention to ethical upholdance, data validity, and fair visual representations.
Germ swab
From my own personal experience, germ swab content campaigns are the most fun, and often, the most disturbing. Fractl did some research a while back about the emotions that make content go viral, and oftentimes, germ swab campaigns hit all of the right emotions in the viral equation.
Negative emotions like disgust are often evoked when reviewing the results of germ swab campaigns. Our study found that when negative emotions are paired with emotions like anticipation or surprise, they can still achieve viral success (internet viral, not germ viral). What is more surprising than finding out the airplane tray table is dirtier than a toilet seat?
Publishers around the world seemed to think the content was surprising, too. This campaign performed above the norm for a typical content campaign earning 38 dofollows and 195 total press mentions — and this was before the COVID-19 pandemic.
Participatory methods
Participatory methods are campaigns that require active participation for the methodology. These are unique ideas — no two are alike. Some examples of campaigns that fall under the participatory methods category are when we had team members do a 30-day squat challenge, asked respondents to draw brand logos from memory, or when we literally drove from D.C. to NYC with a dash cam to record traffic violations.
These campaigns have a certain level of risk associated with them. They require a lot of upfront effort and planning without the promise of any return — and that’s scary for clients and for our team who put in tremendous effort to pull them off.
As you can see from the chart above, however, these ideas collectively performed right on par with other campaign types, and even better than survey methodologies for both the number of dofollow links and press mentions. In order to reap big benefits, it seems you need to be willing to take a big risk.
Social media
Social medIa as a data source is almost a no-brainer, right up there with survey methodologies and publicly available data sets. Unlike participatory methods campaigns, you don’t have to leave your computer in order to produce a campaign based on social media data.
Through our seven years of content creation, Fractl has produced campaigns based on data scrapes from Twitter, Instagram, Facebook, LinkedIn, Reddit, and more. From this experience, we know firsthand what kinds of social campaigns work and which ones fall flat.
The best thing about using social media as a source for content is that it can be applied to all verticals.
The biggest lesson we’ve learned from producing content based on social media data is that the methodology is typically subjective, so you need to keep the project lighthearted in nature in order to earn major coverage.
For example, we produced a campaign for a client in which we looked at Instagram posts with the hashtag #sexy and a geolocation. From this, we were able to glean the “sexiest” countries in the world as well as U.S. states.
While it would be impossible to learn what the actual sexiest places in the world were, (what does that even mean?) we were able to produce a fun campaign that used geo-bait to appeal to lighthearted publishers, like Glamour, E! Online, Women's Health, and Elite Daily.
Make sure that no matter the topic, whatever you produce contributes to an ongoing conversation. Statistics that don’t point to anything meaningful won’t be relevant for writers actually trying to add to the conversation.
Client data
Client data is often the most underappreciated data source for content marketers. You may be sitting on a wealth of actionable industry insights and not even know it.
You might think of internal data as only being useful for improving your internal processes at work, but it can also be valuable outside of your organization.
Unlike publicly available data, internal data is never-before-seen and 100% unique. Journalists eat this up because it means that you’re providing completely exclusive resources.
Think of this article, for example. This article is filled with data and insights that Fractl has gleaned after producing thousands of content marketing campaigns.
An added bonus of using internal data to craft your content is that, according to our analysis, it performs on par with surveys. Unlike surveys, though, it’s completely free.
Conclusion
No matter what methodology you’re using or vertical you’re creating content for, it’s important to realize that as content creators, we have an ethical and moral responsibility to create with an audience in mind.
With “fake news” on the forefront of everyone’s minds, building and maintaining trust with writers and editors is of the utmost importance.
All of the content you produce and promote must be assessed through a rigorous methodological lens to ensure that content is accurate and informative as well as eye-grabbing and entertaining.
Regardless of your methodology, if you don’t take the proper steps to make sure your data sources are accurate, you are contributing to the fake news epidemic.
Sign up for The Moz Top 10, a semimonthly mailer updating you on the top ten hottest pieces of SEO news, tips, and rad links uncovered by the Moz team. Think of it as your exclusive digest of stuff you don't have time to hunt down but want to read!
from The Moz Blog http://tracking.feedpress.it/link/9375/13684223
0 notes
Text
How to Choose the Most Link-Worthy Data Source for Your Content
Posted by Domenica
Fractl has produced thousands of content marketing campaigns across every topic, and for the past seven years, we’ve been keeping track of each and every campaign in order to refine and improve the content we produce on behalf of our clients.
In my last post for Moz, I explained how to set realistic digital PR expectations for your content based on your niche. In this topic, I want to dive a little bit deeper into the data and share insights about how the source of your content can be just as important in determining how your content will perform.
In this analysis, I looked at 1,474 client content campaigns across six different data source categories:
Client data
Social media
Participatory methods
Publicly available data
Survey
Germ swab
It’s important to note that there are countless other data sources that we use for content campaigns every day at Fractl that are not mentioned in this article. In this analysis, each category has at least 20 campaigns, while some categories have several hundred campaigns.
It’s also important to note that averages were collected by excluding upper outliers. For campaigns that went “viral” and performed well above the norm, we excluded them in the calculation so as not to skew the averages higher.
In addition to sharing link and press averages, I will also be walking through how to produce pressworthy, sharable content from each data source and providing examples.
Managing expectations across content types
Across the entire sample of 1,474 campaigns, a project on average received 24 dofollow links and 89 press mentions in total.
A press mention is defined as any time the content campaign was mentioned on a publisher’s website.
There were some individual data source category averages that were on par with the sample average, while other categories deviated greatly from the sample average.
Publicly available data
For almost any niche out there, you can bet there is a publicly available data set available for use. Some examples include data from the CDC, the U.S. Census, colleges and universities, the WHO, and the TSA. The opportunities really are endless when it comes to using publicly available data as a methodology for your content.
While free data sets can be a treasure trove of information for your content, keep in mind that they’re not always the simplest to work with. They do require a lot of analysis to make sense of the massive amount of information in them, and to make the insights digestible for your audience.
Take for example a campaign we produced for a client called Neighborhood Names. The data was free from the US Census, but in order to make any sense of it, our researchers had to use QGIS, Python, text-mining, and phrasemachine (a text analysis API) just to narrow it down to what we were looking for.
And what were we looking for? Looking at neighborhood names across America seems boring at first, until you realize that certain words correspond to wealth.
I was the outreach specialist for this project, and by using the wealth angle, I was able to secure two notable placements on CNBC as well as a press mention on MSN. The project quickly made its way around the internet after that, earning 76 dofollow links and 202 total press mentions by the end of our reporting period.
Survey
Unlike scouring the internet for free data, using a survey as a methodology can be more costly. That being said, there is one major advantage to using a survey to shape your content: you can find out anything you want.
While publicly available data will tell a story, it’s not always the story you want to tell, and that’s where surveys come in.
Of course, when it comes to surveys, anyone can create one without paying attention to research method best practices. That's one of the problems we need to address. With “fake news” in the forefront of everyone’s minds in 2020, building trust with journalists and editors is of the utmost importance.
As content creators, we have a responsibility to ensure that content is not only attention-grabbing and entertaining, but also accurate and informative.
Survey campaigns, in particular, require you to analyze responses through a rigorous methodological lens. When collecting data for surveys, be sure to pay close attention to ethical upholdance, data validity, and fair visual representations.
Germ swab
From my own personal experience, germ swab content campaigns are the most fun, and often, the most disturbing. Fractl did some research a while back about the emotions that make content go viral, and oftentimes, germ swab campaigns hit all of the right emotions in the viral equation.
Negative emotions like disgust are often evoked when reviewing the results of germ swab campaigns. Our study found that when negative emotions are paired with emotions like anticipation or surprise, they can still achieve viral success (internet viral, not germ viral). What is more surprising than finding out the airplane tray table is dirtier than a toilet seat?
Publishers around the world seemed to think the content was surprising, too. This campaign performed above the norm for a typical content campaign earning 38 dofollows and 195 total press mentions — and this was before the COVID-19 pandemic.
Participatory methods
Participatory methods are campaigns that require active participation for the methodology. These are unique ideas — no two are alike. Some examples of campaigns that fall under the participatory methods category are when we had team members do a 30-day squat challenge, asked respondents to draw brand logos from memory, or when we literally drove from D.C. to NYC with a dash cam to record traffic violations.
These campaigns have a certain level of risk associated with them. They require a lot of upfront effort and planning without the promise of any return — and that’s scary for clients and for our team who put in tremendous effort to pull them off.
As you can see from the chart above, however, these ideas collectively performed right on par with other campaign types, and even better than survey methodologies for both the number of dofollow links and press mentions. In order to reap big benefits, it seems you need to be willing to take a big risk.
Social media
Social medIa as a data source is almost a no-brainer, right up there with survey methodologies and publicly available data sets. Unlike participatory methods campaigns, you don’t have to leave your computer in order to produce a campaign based on social media data.
Through our seven years of content creation, Fractl has produced campaigns based on data scrapes from Twitter, Instagram, Facebook, LinkedIn, Reddit, and more. From this experience, we know firsthand what kinds of social campaigns work and which ones fall flat.
The best thing about using social media as a source for content is that it can be applied to all verticals.
The biggest lesson we’ve learned from producing content based on social media data is that the methodology is typically subjective, so you need to keep the project lighthearted in nature in order to earn major coverage.
For example, we produced a campaign for a client in which we looked at Instagram posts with the hashtag #sexy and a geolocation. From this, we were able to glean the “sexiest” countries in the world as well as U.S. states.
While it would be impossible to learn what the actual sexiest places in the world were, (what does that even mean?) we were able to produce a fun campaign that used geo-bait to appeal to lighthearted publishers, like Glamour, E! Online, Women's Health, and Elite Daily.
Make sure that no matter the topic, whatever you produce contributes to an ongoing conversation. Statistics that don’t point to anything meaningful won’t be relevant for writers actually trying to add to the conversation.
Client data
Client data is often the most underappreciated data source for content marketers. You may be sitting on a wealth of actionable industry insights and not even know it.
You might think of internal data as only being useful for improving your internal processes at work, but it can also be valuable outside of your organization.
Unlike publicly available data, internal data is never-before-seen and 100% unique. Journalists eat this up because it means that you’re providing completely exclusive resources.
Think of this article, for example. This article is filled with data and insights that Fractl has gleaned after producing thousands of content marketing campaigns.
An added bonus of using internal data to craft your content is that, according to our analysis, it performs on par with surveys. Unlike surveys, though, it’s completely free.
Conclusion
No matter what methodology you’re using or vertical you’re creating content for, it’s important to realize that as content creators, we have an ethical and moral responsibility to create with an audience in mind.
With “fake news” on the forefront of everyone’s minds, building and maintaining trust with writers and editors is of the utmost importance.
All of the content you produce and promote must be assessed through a rigorous methodological lens to ensure that content is accurate and informative as well as eye-grabbing and entertaining.
Regardless of your methodology, if you don’t take the proper steps to make sure your data sources are accurate, you are contributing to the fake news epidemic.
Sign up for The Moz Top 10, a semimonthly mailer updating you on the top ten hottest pieces of SEO news, tips, and rad links uncovered by the Moz team. Think of it as your exclusive digest of stuff you don't have time to hunt down but want to read!
0 notes
Text
How to Choose the Most Link-Worthy Data Source for Your Content
New Post has been published on http://tiptopreview.com/how-to-choose-the-most-link-worthy-data-source-for-your-content/
How to Choose the Most Link-Worthy Data Source for Your Content
Fractl has produced thousands of content marketing campaigns across every topic, and for the past seven years, we’ve been keeping track of each and every campaign in order to refine and improve the content we produce on behalf of our clients.
In my last post for Moz, I explained how to set realistic digital PR expectations for your content based on your niche. In this topic, I want to dive a little bit deeper into the data and share insights about how the source of your content can be just as important in determining how your content will perform.
In this analysis, I looked at 1,474 client content campaigns across six different data source categories:
Client data
Social media
Participatory methods
Publicly available data
Survey
Germ swab
It’s important to note that there are countless other data sources that we use for content campaigns every day at Fractl that are not mentioned in this article. In this analysis, each category has at least 20 campaigns, while some categories have several hundred campaigns.
It’s also important to note that averages were collected by excluding upper outliers. For campaigns that went “viral” and performed well above the norm, we excluded them in the calculation so as not to skew the averages higher.
In addition to sharing link and press averages, I will also be walking through how to produce pressworthy, sharable content from each data source and providing examples.
Managing expectations across content types
Across the entire sample of 1,474 campaigns, a project on average received 24 dofollow links and 89 press mentions in total.
A press mention is defined as any time the content campaign was mentioned on a publisher’s website.
There were some individual data source category averages that were on par with the sample average, while other categories deviated greatly from the sample average.
Publicly available data
For almost any niche out there, you can bet there is a publicly available data set available for use. Some examples include data from the CDC, the U.S. Census, colleges and universities, the WHO, and the TSA. The opportunities really are endless when it comes to using publicly available data as a methodology for your content.
While free data sets can be a treasure trove of information for your content, keep in mind that they’re not always the simplest to work with. They do require a lot of analysis to make sense of the massive amount of information in them, and to make the insights digestible for your audience.
Take for example a campaign we produced for a client called Neighborhood Names. The data was free from the US Census, but in order to make any sense of it, our researchers had to use QGIS, Python, text-mining, and phrasemachine (a text analysis API) just to narrow it down to what we were looking for.
And what were we looking for? Looking at neighborhood names across America seems boring at first, until you realize that certain words correspond to wealth.
I was the outreach specialist for this project, and by using the wealth angle, I was able to secure two notable placements on CNBC as well as a press mention on MSN. The project quickly made its way around the internet after that, earning 76 dofollow links and 202 total press mentions by the end of our reporting period.
Survey
Unlike scouring the internet for free data, using a survey as a methodology can be more costly. That being said, there is one major advantage to using a survey to shape your content: you can find out anything you want.
While publicly available data will tell a story, it’s not always the story you want to tell, and that’s where surveys come in.
Of course, when it comes to surveys, anyone can create one without paying attention to research method best practices. That’s one of the problems we need to address. With “fake news” in the forefront of everyone’s minds in 2020, building trust with journalists and editors is of the utmost importance.
As content creators, we have a responsibility to ensure that content is not only attention-grabbing and entertaining, but also accurate and informative.
Survey campaigns, in particular, require you to analyze responses through a rigorous methodological lens. When collecting data for surveys, be sure to pay close attention to ethical upholdance, data validity, and fair visual representations.
Germ swab
From my own personal experience, germ swab content campaigns are the most fun, and often, the most disturbing. Fractl did some research a while back about the emotions that make content go viral, and oftentimes, germ swab campaigns hit all of the right emotions in the viral equation.
Negative emotions like disgust are often evoked when reviewing the results of germ swab campaigns. Our study found that when negative emotions are paired with emotions like anticipation or surprise, they can still achieve viral success (internet viral, not germ viral). What is more surprising than finding out the airplane tray table is dirtier than a toilet seat?
Publishers around the world seemed to think the content was surprising, too. This campaign performed above the norm for a typical content campaign earning 38 dofollows and 195 total press mentions — and this was before the COVID-19 pandemic.
Participatory methods
Participatory methods are campaigns that require active participation for the methodology. These are unique ideas — no two are alike. Some examples of campaigns that fall under the participatory methods category are when we had team members do a 30-day squat challenge, asked respondents to draw brand logos from memory, or when we literally drove from D.C. to NYC with a dash cam to record traffic violations.
These campaigns have a certain level of risk associated with them. They require a lot of upfront effort and planning without the promise of any return — and that’s scary for clients and for our team who put in tremendous effort to pull them off.
As you can see from the chart above, however, these ideas collectively performed right on par with other campaign types, and even better than survey methodologies for both the number of dofollow links and press mentions. In order to reap big benefits, it seems you need to be willing to take a big risk.
Social media
Social medIa as a data source is almost a no-brainer, right up there with survey methodologies and publicly available data sets. Unlike participatory methods campaigns, you don’t have to leave your computer in order to produce a campaign based on social media data.
Through our seven years of content creation, Fractl has produced campaigns based on data scrapes from Twitter, Instagram, Facebook, LinkedIn, Reddit, and more. From this experience, we know firsthand what kinds of social campaigns work and which ones fall flat.
The best thing about using social media as a source for content is that it can be applied to all verticals.
The biggest lesson we’ve learned from producing content based on social media data is that the methodology is typically subjective, so you need to keep the project lighthearted in nature in order to earn major coverage.
For example, we produced a campaign for a client in which we looked at Instagram posts with the hashtag #sexy and a geolocation. From this, we were able to glean the “sexiest” countries in the world as well as U.S. states.
While it would be impossible to learn what the actual sexiest places in the world were, (what does that even mean?) we were able to produce a fun campaign that used geo-bait to appeal to lighthearted publishers, like Glamour, E! Online, Women’s Health, and Elite Daily.
Make sure that no matter the topic, whatever you produce contributes to an ongoing conversation. Statistics that don’t point to anything meaningful won’t be relevant for writers actually trying to add to the conversation.
Client data
Client data is often the most underappreciated data source for content marketers. You may be sitting on a wealth of actionable industry insights and not even know it.
You might think of internal data as only being useful for improving your internal processes at work, but it can also be valuable outside of your organization.
Unlike publicly available data, internal data is never-before-seen and 100% unique. Journalists eat this up because it means that you’re providing completely exclusive resources.
Think of this article, for example. This article is filled with data and insights that Fractl has gleaned after producing thousands of content marketing campaigns.
An added bonus of using internal data to craft your content is that, according to our analysis, it performs on par with surveys. Unlike surveys, though, it’s completely free.
Conclusion
No matter what methodology you’re using or vertical you’re creating content for, it’s important to realize that as content creators, we have an ethical and moral responsibility to create with an audience in mind.
With “fake news” on the forefront of everyone’s minds, building and maintaining trust with writers and editors is of the utmost importance.
All of the content you produce and promote must be assessed through a rigorous methodological lens to ensure that content is accurate and informative as well as eye-grabbing and entertaining.
Regardless of your methodology, if you don’t take the proper steps to make sure your data sources are accurate, you are contributing to the fake news epidemic.
Source link
0 notes
Text
How to Choose the Most Link-Worthy Data Source for Your Content
Posted by Domenica
Fractl has produced thousands of content marketing campaigns across every topic, and for the past seven years, we’ve been keeping track of each and every campaign in order to refine and improve the content we produce on behalf of our clients.
In my last post for Moz, I explained how to set realistic digital PR expectations for your content based on your niche. In this topic, I want to dive a little bit deeper into the data and share insights about how the source of your content can be just as important in determining how your content will perform.
In this analysis, I looked at 1,474 client content campaigns across six different data source categories:
Client data
Social media
Participatory methods
Publicly available data
Survey
Germ swab
It’s important to note that there are countless other data sources that we use for content campaigns every day at Fractl that are not mentioned in this article. In this analysis, each category has at least 20 campaigns, while some categories have several hundred campaigns.
It’s also important to note that averages were collected by excluding upper outliers. For campaigns that went “viral” and performed well above the norm, we excluded them in the calculation so as not to skew the averages higher.
In addition to sharing link and press averages, I will also be walking through how to produce pressworthy, sharable content from each data source and providing examples.
Managing expectations across content types
Across the entire sample of 1,474 campaigns, a project on average received 24 dofollow links and 89 press mentions in total.
A press mention is defined as any time the content campaign was mentioned on a publisher’s website.
There were some individual data source category averages that were on par with the sample average, while other categories deviated greatly from the sample average.
Publicly available data
For almost any niche out there, you can bet there is a publicly available data set available for use. Some examples include data from the CDC, the U.S. Census, colleges and universities, the WHO, and the TSA. The opportunities really are endless when it comes to using publicly available data as a methodology for your content.
While free data sets can be a treasure trove of information for your content, keep in mind that they’re not always the simplest to work with. They do require a lot of analysis to make sense of the massive amount of information in them, and to make the insights digestible for your audience.
Take for example a campaign we produced for a client called Neighborhood Names. The data was free from the US Census, but in order to make any sense of it, our researchers had to use QGIS, Python, text-mining, and phrasemachine (a text analysis API) just to narrow it down to what we were looking for.
And what were we looking for? Looking at neighborhood names across America seems boring at first, until you realize that certain words correspond to wealth.
I was the outreach specialist for this project, and by using the wealth angle, I was able to secure two notable placements on CNBC as well as a press mention on MSN. The project quickly made its way around the internet after that, earning 76 dofollow links and 202 total press mentions by the end of our reporting period.
Survey
Unlike scouring the internet for free data, using a survey as a methodology can be more costly. That being said, there is one major advantage to using a survey to shape your content: you can find out anything you want.
While publicly available data will tell a story, it’s not always the story you want to tell, and that’s where surveys come in.
Of course, when it comes to surveys, anyone can create one without paying attention to research method best practices. That's one of the problems we need to address. With “fake news” in the forefront of everyone’s minds in 2020, building trust with journalists and editors is of the utmost importance.
As content creators, we have a responsibility to ensure that content is not only attention-grabbing and entertaining, but also accurate and informative.
Survey campaigns, in particular, require you to analyze responses through a rigorous methodological lens. When collecting data for surveys, be sure to pay close attention to ethical upholdance, data validity, and fair visual representations.
Germ swab
From my own personal experience, germ swab content campaigns are the most fun, and often, the most disturbing. Fractl did some research a while back about the emotions that make content go viral, and oftentimes, germ swab campaigns hit all of the right emotions in the viral equation.
Negative emotions like disgust are often evoked when reviewing the results of germ swab campaigns. Our study found that when negative emotions are paired with emotions like anticipation or surprise, they can still achieve viral success (internet viral, not germ viral). What is more surprising than finding out the airplane tray table is dirtier than a toilet seat?
Publishers around the world seemed to think the content was surprising, too. This campaign performed above the norm for a typical content campaign earning 38 dofollows and 195 total press mentions — and this was before the COVID-19 pandemic.
Participatory methods
Participatory methods are campaigns that require active participation for the methodology. These are unique ideas — no two are alike. Some examples of campaigns that fall under the participatory methods category are when we had team members do a 30-day squat challenge, asked respondents to draw brand logos from memory, or when we literally drove from D.C. to NYC with a dash cam to record traffic violations.
These campaigns have a certain level of risk associated with them. They require a lot of upfront effort and planning without the promise of any return — and that’s scary for clients and for our team who put in tremendous effort to pull them off.
As you can see from the chart above, however, these ideas collectively performed right on par with other campaign types, and even better than survey methodologies for both the number of dofollow links and press mentions. In order to reap big benefits, it seems you need to be willing to take a big risk.
Social media
Social medIa as a data source is almost a no-brainer, right up there with survey methodologies and publicly available data sets. Unlike participatory methods campaigns, you don’t have to leave your computer in order to produce a campaign based on social media data.
Through our seven years of content creation, Fractl has produced campaigns based on data scrapes from Twitter, Instagram, Facebook, LinkedIn, Reddit, and more. From this experience, we know firsthand what kinds of social campaigns work and which ones fall flat.
The best thing about using social media as a source for content is that it can be applied to all verticals.
The biggest lesson we’ve learned from producing content based on social media data is that the methodology is typically subjective, so you need to keep the project lighthearted in nature in order to earn major coverage.
For example, we produced a campaign for a client in which we looked at Instagram posts with the hashtag #sexy and a geolocation. From this, we were able to glean the “sexiest” countries in the world as well as U.S. states.
While it would be impossible to learn what the actual sexiest places in the world were, (what does that even mean?) we were able to produce a fun campaign that used geo-bait to appeal to lighthearted publishers, like Glamour, E! Online, Women's Health, and Elite Daily.
Make sure that no matter the topic, whatever you produce contributes to an ongoing conversation. Statistics that don’t point to anything meaningful won’t be relevant for writers actually trying to add to the conversation.
Client data
Client data is often the most underappreciated data source for content marketers. You may be sitting on a wealth of actionable industry insights and not even know it.
You might think of internal data as only being useful for improving your internal processes at work, but it can also be valuable outside of your organization.
Unlike publicly available data, internal data is never-before-seen and 100% unique. Journalists eat this up because it means that you’re providing completely exclusive resources.
Think of this article, for example. This article is filled with data and insights that Fractl has gleaned after producing thousands of content marketing campaigns.
An added bonus of using internal data to craft your content is that, according to our analysis, it performs on par with surveys. Unlike surveys, though, it’s completely free.
Conclusion
No matter what methodology you’re using or vertical you’re creating content for, it’s important to realize that as content creators, we have an ethical and moral responsibility to create with an audience in mind.
With “fake news” on the forefront of everyone’s minds, building and maintaining trust with writers and editors is of the utmost importance.
All of the content you produce and promote must be assessed through a rigorous methodological lens to ensure that content is accurate and informative as well as eye-grabbing and entertaining.
Regardless of your methodology, if you don’t take the proper steps to make sure your data sources are accurate, you are contributing to the fake news epidemic.
Sign up for The Moz Top 10, a semimonthly mailer updating you on the top ten hottest pieces of SEO news, tips, and rad links uncovered by the Moz team. Think of it as your exclusive digest of stuff you don't have time to hunt down but want to read!
#túi_giấy_epacking_việt_nam #túi_giấy_epacking #in_túi_giấy_giá_rẻ #in_túi_giấy #epackingvietnam #tuigiayepacking
0 notes
Text
How to Choose the Most Link-Worthy Data Source for Your Content
Posted by Domenica
Fractl has produced thousands of content marketing campaigns across every topic, and for the past seven years, we’ve been keeping track of each and every campaign in order to refine and improve the content we produce on behalf of our clients.
In my last post for Moz, I explained how to set realistic digital PR expectations for your content based on your niche. In this topic, I want to dive a little bit deeper into the data and share insights about how the source of your content can be just as important in determining how your content will perform.
In this analysis, I looked at 1,474 client content campaigns across six different data source categories:
Client data
Social media
Participatory methods
Publicly available data
Survey
Germ swab
It’s important to note that there are countless other data sources that we use for content campaigns every day at Fractl that are not mentioned in this article. In this analysis, each category has at least 20 campaigns, while some categories have several hundred campaigns.
It’s also important to note that averages were collected by excluding upper outliers. For campaigns that went “viral” and performed well above the norm, we excluded them in the calculation so as not to skew the averages higher.
In addition to sharing link and press averages, I will also be walking through how to produce pressworthy, sharable content from each data source and providing examples.
Managing expectations across content types
Across the entire sample of 1,474 campaigns, a project on average received 24 dofollow links and 89 press mentions in total.
A press mention is defined as any time the content campaign was mentioned on a publisher’s website.
There were some individual data source category averages that were on par with the sample average, while other categories deviated greatly from the sample average.
Publicly available data
For almost any niche out there, you can bet there is a publicly available data set available for use. Some examples include data from the CDC, the U.S. Census, colleges and universities, the WHO, and the TSA. The opportunities really are endless when it comes to using publicly available data as a methodology for your content.
While free data sets can be a treasure trove of information for your content, keep in mind that they’re not always the simplest to work with. They do require a lot of analysis to make sense of the massive amount of information in them, and to make the insights digestible for your audience.
Take for example a campaign we produced for a client called Neighborhood Names. The data was free from the US Census, but in order to make any sense of it, our researchers had to use QGIS, Python, text-mining, and phrasemachine (a text analysis API) just to narrow it down to what we were looking for.
And what were we looking for? Looking at neighborhood names across America seems boring at first, until you realize that certain words correspond to wealth.
I was the outreach specialist for this project, and by using the wealth angle, I was able to secure two notable placements on CNBC as well as a press mention on MSN. The project quickly made its way around the internet after that, earning 76 dofollow links and 202 total press mentions by the end of our reporting period.
Survey
Unlike scouring the internet for free data, using a survey as a methodology can be more costly. That being said, there is one major advantage to using a survey to shape your content: you can find out anything you want.
While publicly available data will tell a story, it’s not always the story you want to tell, and that’s where surveys come in.
Of course, when it comes to surveys, anyone can create one without paying attention to research method best practices. That's one of the problems we need to address. With “fake news” in the forefront of everyone’s minds in 2020, building trust with journalists and editors is of the utmost importance.
As content creators, we have a responsibility to ensure that content is not only attention-grabbing and entertaining, but also accurate and informative.
Survey campaigns, in particular, require you to analyze responses through a rigorous methodological lens. When collecting data for surveys, be sure to pay close attention to ethical upholdance, data validity, and fair visual representations.
Germ swab
From my own personal experience, germ swab content campaigns are the most fun, and often, the most disturbing. Fractl did some research a while back about the emotions that make content go viral, and oftentimes, germ swab campaigns hit all of the right emotions in the viral equation.
Negative emotions like disgust are often evoked when reviewing the results of germ swab campaigns. Our study found that when negative emotions are paired with emotions like anticipation or surprise, they can still achieve viral success (internet viral, not germ viral). What is more surprising than finding out the airplane tray table is dirtier than a toilet seat?
Publishers around the world seemed to think the content was surprising, too. This campaign performed above the norm for a typical content campaign earning 38 dofollows and 195 total press mentions — and this was before the COVID-19 pandemic.
Participatory methods
Participatory methods are campaigns that require active participation for the methodology. These are unique ideas — no two are alike. Some examples of campaigns that fall under the participatory methods category are when we had team members do a 30-day squat challenge, asked respondents to draw brand logos from memory, or when we literally drove from D.C. to NYC with a dash cam to record traffic violations.
These campaigns have a certain level of risk associated with them. They require a lot of upfront effort and planning without the promise of any return — and that’s scary for clients and for our team who put in tremendous effort to pull them off.
As you can see from the chart above, however, these ideas collectively performed right on par with other campaign types, and even better than survey methodologies for both the number of dofollow links and press mentions. In order to reap big benefits, it seems you need to be willing to take a big risk.
Social media
Social medIa as a data source is almost a no-brainer, right up there with survey methodologies and publicly available data sets. Unlike participatory methods campaigns, you don’t have to leave your computer in order to produce a campaign based on social media data.
Through our seven years of content creation, Fractl has produced campaigns based on data scrapes from Twitter, Instagram, Facebook, LinkedIn, Reddit, and more. From this experience, we know firsthand what kinds of social campaigns work and which ones fall flat.
The best thing about using social media as a source for content is that it can be applied to all verticals.
The biggest lesson we’ve learned from producing content based on social media data is that the methodology is typically subjective, so you need to keep the project lighthearted in nature in order to earn major coverage.
For example, we produced a campaign for a client in which we looked at Instagram posts with the hashtag #sexy and a geolocation. From this, we were able to glean the “sexiest” countries in the world as well as U.S. states.
While it would be impossible to learn what the actual sexiest places in the world were, (what does that even mean?) we were able to produce a fun campaign that used geo-bait to appeal to lighthearted publishers, like Glamour, E! Online, Women's Health, and Elite Daily.
Make sure that no matter the topic, whatever you produce contributes to an ongoing conversation. Statistics that don’t point to anything meaningful won’t be relevant for writers actually trying to add to the conversation.
Client data
Client data is often the most underappreciated data source for content marketers. You may be sitting on a wealth of actionable industry insights and not even know it.
You might think of internal data as only being useful for improving your internal processes at work, but it can also be valuable outside of your organization.
Unlike publicly available data, internal data is never-before-seen and 100% unique. Journalists eat this up because it means that you’re providing completely exclusive resources.
Think of this article, for example. This article is filled with data and insights that Fractl has gleaned after producing thousands of content marketing campaigns.
An added bonus of using internal data to craft your content is that, according to our analysis, it performs on par with surveys. Unlike surveys, though, it’s completely free.
Conclusion
No matter what methodology you’re using or vertical you’re creating content for, it’s important to realize that as content creators, we have an ethical and moral responsibility to create with an audience in mind.
With “fake news” on the forefront of everyone’s minds, building and maintaining trust with writers and editors is of the utmost importance.
All of the content you produce and promote must be assessed through a rigorous methodological lens to ensure that content is accurate and informative as well as eye-grabbing and entertaining.
Regardless of your methodology, if you don’t take the proper steps to make sure your data sources are accurate, you are contributing to the fake news epidemic.
Sign up for The Moz Top 10, a semimonthly mailer updating you on the top ten hottest pieces of SEO news, tips, and rad links uncovered by the Moz team. Think of it as your exclusive digest of stuff you don't have time to hunt down but want to read!
from The Moz Blog https://ift.tt/2BLLSab More on https://seouk4.weebly.com/
0 notes